开始
在此示例中,您将在模拟交易数据集上生成标注。对于每个客户,您想要标注未来一小时内总购买金额是否会超过 300 美元。此外,您希望提前一小时进行预测。
[1]:
import composeml as cp
加载数据
安装好软件包后,加载数据。为了了解交易数据的大致样子,预览数据框。
[2]:
df = cp.demos.load_transactions()

df[df.columns[:7]].head()
[2]:
| transaction_id | session_id | transaction_time | product_id | amount | customer_id | device | |
|---|---|---|---|---|---|---|---|
| 0 | 298 | 1 | 2014-01-01 00:00:00 | 5 | 127.64 | 2 | desktop |
| 1 | 10 | 1 | 2014-01-01 00:09:45 | 5 | 57.39 | 2 | desktop |
| 2 | 495 | 1 | 2014-01-01 00:14:05 | 5 | 69.45 | 2 | desktop |
| 3 | 460 | 10 | 2014-01-01 02:33:50 | 5 | 123.19 | 2 | tablet |
| 4 | 302 | 10 | 2014-01-01 02:37:05 | 5 | 64.47 | 2 | tablet |
创建标注函数
定义标注函数,该函数返回给定一小时内交易的总购买金额。
[3]:
def total_spent(df):
    total = df['amount'].sum()
    return total
构建标注器
使用标注函数,为此预测问题创建 LabelMaker。要处理每个客户的一小时交易,请将 target_dataframe_index 设置为客户 ID,并将 window_size 设置为一小时。
[4]:
label_maker = cp.LabelMaker(
    target_dataframe_index="customer_id",
    time_index="transaction_time",
    labeling_function=total_spent,
    window_size="1h",
)
生成标注
使用 LabelMaker.search() 自动搜索并提取标注。
[5]:
labels = label_maker.search(
    df.sort_values('transaction_time'),
    num_examples_per_instance=-1,
    gap=1,
    verbose=True,
)

labels.head()
Elapsed: 00:00 | Remaining: 00:00 | Progress: 100%|██████████| customer_id: 5/5
[5]:
| customer_id | time | total_spent | |
|---|---|---|---|
| 0 | 1 | 2014-01-01 00:45:30 | 914.73 |
| 1 | 1 | 2014-01-01 00:46:35 | 806.62 |
| 2 | 1 | 2014-01-01 00:47:40 | 694.09 |
| 3 | 1 | 2014-01-01 00:52:00 | 687.80 |
| 4 | 1 | 2014-01-01 00:53:05 | 656.43 |
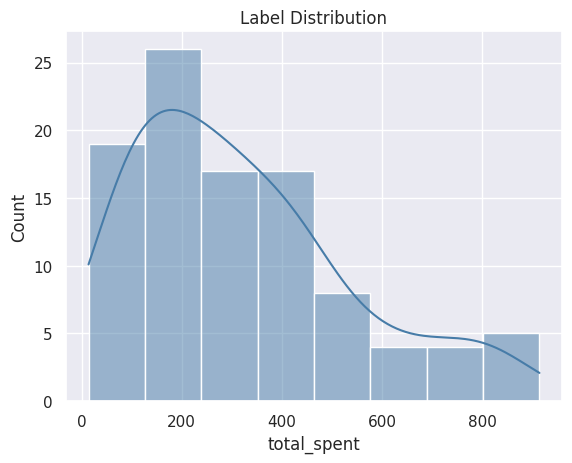
[6]:
%matplotlib inline
plot = labels.plot.dist()
转换标注
使用生成的 LabelTimes,为我们的预测问题应用特定的转换。
对标注应用阈值
为了使标注成为二元,对超过 300 美元的金额应用 LabelTimes.threshold()。
[7]:
labels = labels.threshold(300)

labels.head()
[7]:
| customer_id | time | total_spent | |
|---|---|---|---|
| 0 | 1 | 2014-01-01 00:45:30 | True |
| 1 | 1 | 2014-01-01 00:46:35 | True |
| 2 | 1 | 2014-01-01 00:47:40 | True |
| 3 | 1 | 2014-01-01 00:52:00 | True |
| 4 | 1 | 2014-01-01 00:53:05 | True |
超前标注时间
通过使用 LabelTimes.apply_lead(),将标注时间提前一小时,用于提前预测。
[8]:
labels = labels.apply_lead('1h')

labels.head()
[8]:
| customer_id | time | total_spent | |
|---|---|---|---|
| 0 | 1 | 2013-12-31 23:45:30 | True |
| 1 | 1 | 2013-12-31 23:46:35 | True |
| 2 | 1 | 2013-12-31 23:47:40 | True |
| 3 | 1 | 2013-12-31 23:52:00 | True |
| 4 | 1 | 2013-12-31 23:53:05 | True |
描述标注
转换标注后,使用 LabelTimes.describe() 打印出使用这些设置和转换生成的标注分布。这对于理解如何从原始数据生成标注非常有用。此外,标注分布有助于确定我们是否存在不平衡标注。
[9]:
labels.describe()
Label Distribution
------------------
False      56
True       44
Total:    100


Settings
--------
gap                                    1
maximum_data                        None
minimum_data                        None
num_examples_per_instance             -1
target_column                total_spent
target_dataframe_index       customer_id
target_type                     discrete
window_size                           1h


Transforms
----------
1. threshold
  - value:    300

2. apply_lead
  - value:    1h
绘制标注图
您可以使用图来检查标注。
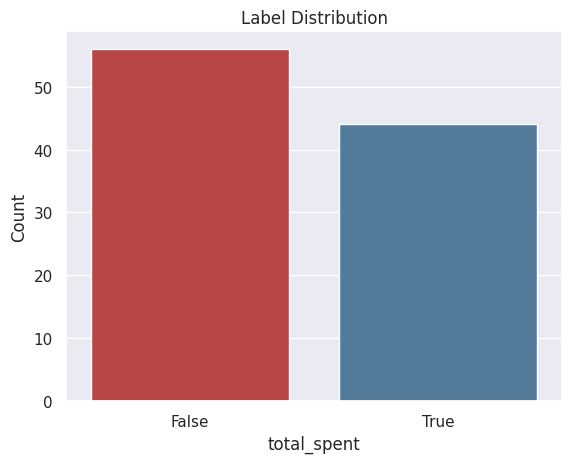
分布
此图显示了标注分布。
[10]:
plot = labels.plot.distribution()
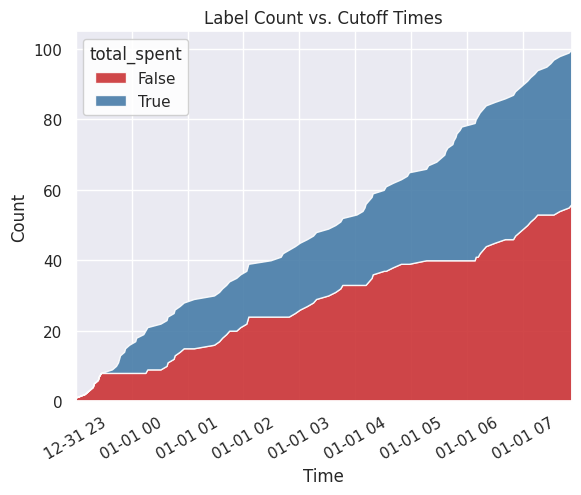
按时间计数
此图显示了跨截止时间的标注分布。
[11]:
plot = labels.plot.count_by_time()